
CANape Option Thermodynamic State Charts
With the option Thermodynamic State Charts for CANape, you can display thermodynamic data synchronized with other measured data and generate highly informative state charts for online and offline analysis.
During the development and testing of all types of air conditioning and cooling systems, physical variables such as pressure and temperature are recorded at the test bench or test vehicle – often together with other measured signals and internal controller values. To evaluate the system configuration and the dimensions of the components and coolant, specific data visualizations are required.
Highlights
- Wide range of configuration options: Customizable state diagram types
- Summary of thermophysical properties: Selected from the extensive TILMedia material database maintained by the specialist firm TLK-Thermo GmbH, which supports the use of both real gases and mixtures
- Online calculation of state diagrams: Application-specific adjustment of isolines possible
Functions
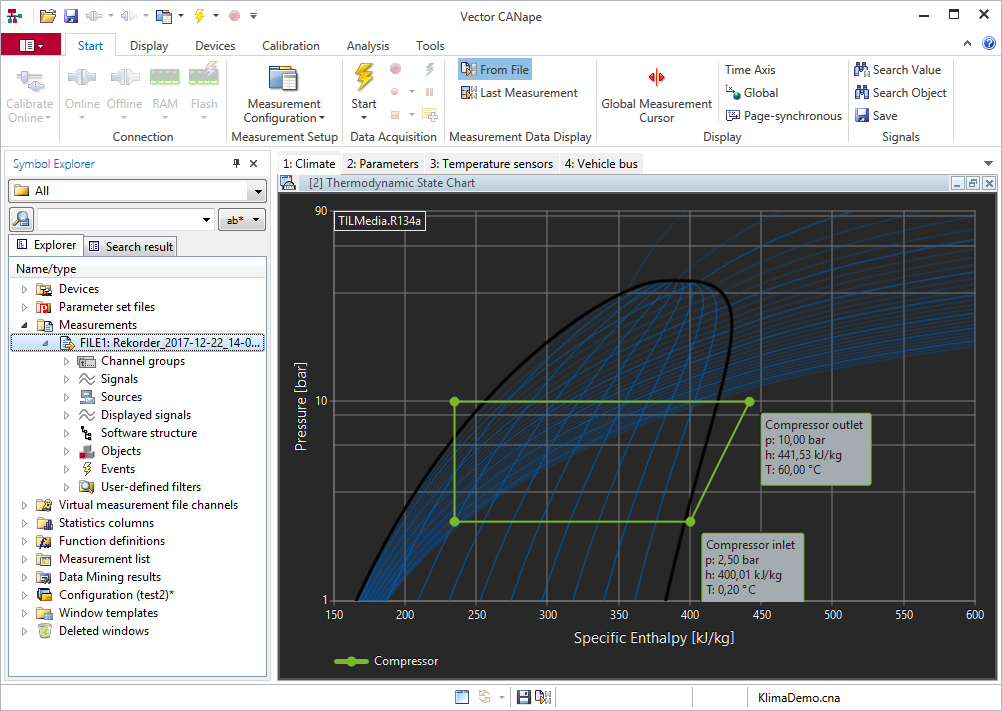
The option Thermodynamic State Charts makes it possible to generate own thermodynamic state charts in just a few clicks. These simplify the analysis of cooling cycles, for example. You can choose between the following types of chart:
- Pressure-enthalpy (ph),
- Pressure-specific volumes (pv),
- Pressure-temperature (pT),
- Temperature-enthalpy (Th)
- Temperature-entropy (Ts)
When configuring your chart, you can choose from a wide range of materials or mixed materials. Based on the material data, the relevant parameters are calculated from the measurement signals, and the phase diagram is generated. This process also enables the determination of missing cycle data points.
Product Descriptions
Related Products