
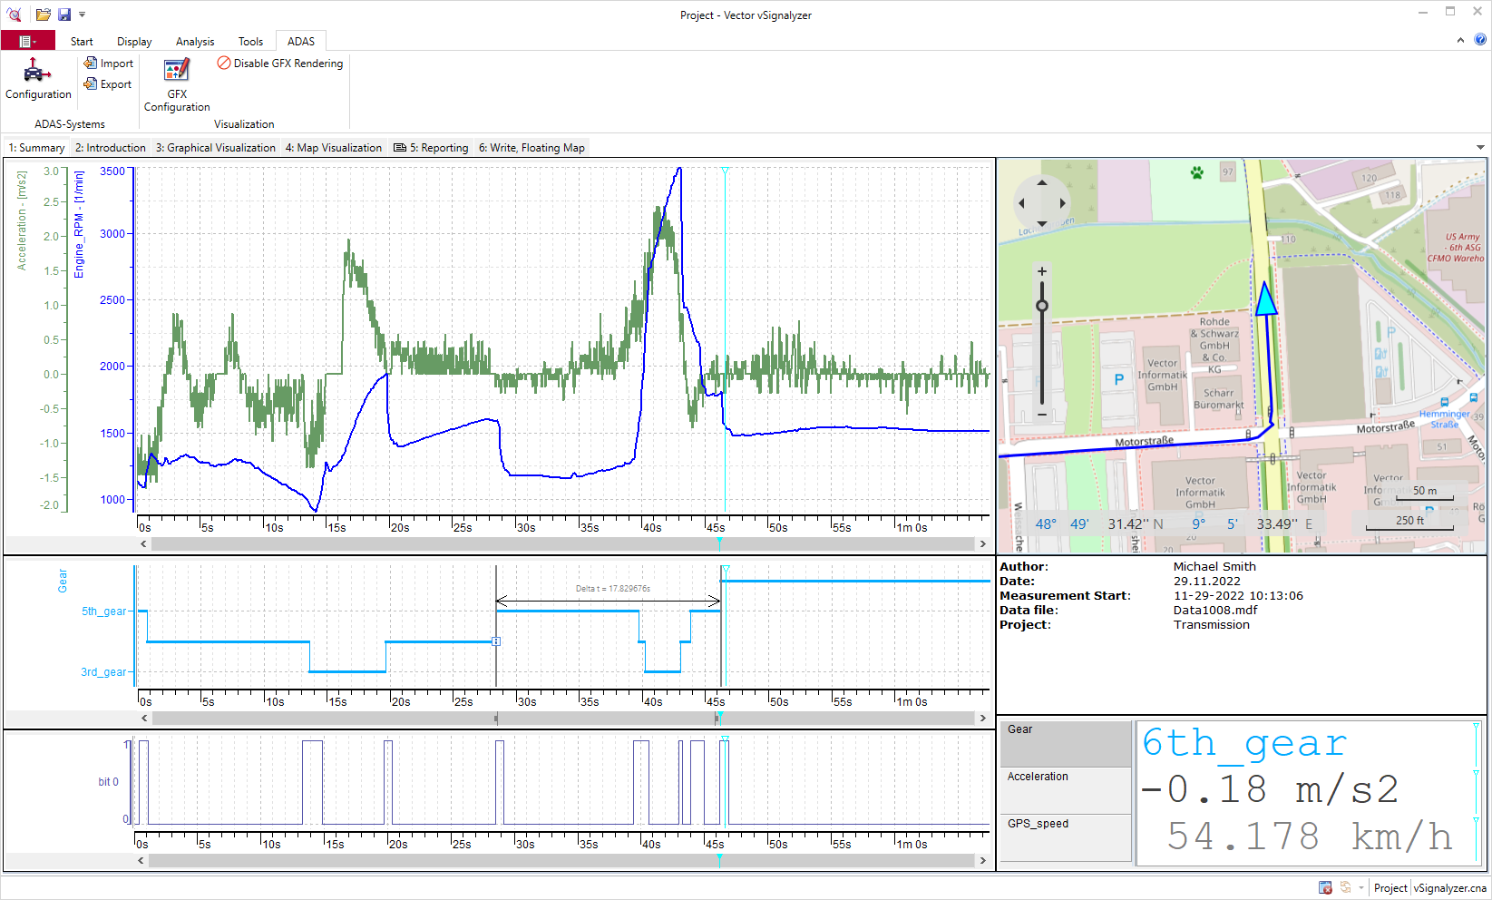
vSignalyzer is the go to tool for evaluation of measurement data offering extensive visualization, manual and automated analysis, and report generation. It supports various file formats for analysis by using a comprehensive function library and integrated data mining tools. Results can be easily inserted into Word, PowerPoint, or printed reports via drag and drop.
Highlights
- Flexible data visualization: Display measurement data clearly and individually for analysis and comparison
- Scalable performance: Efficiently handle even very large measurement files
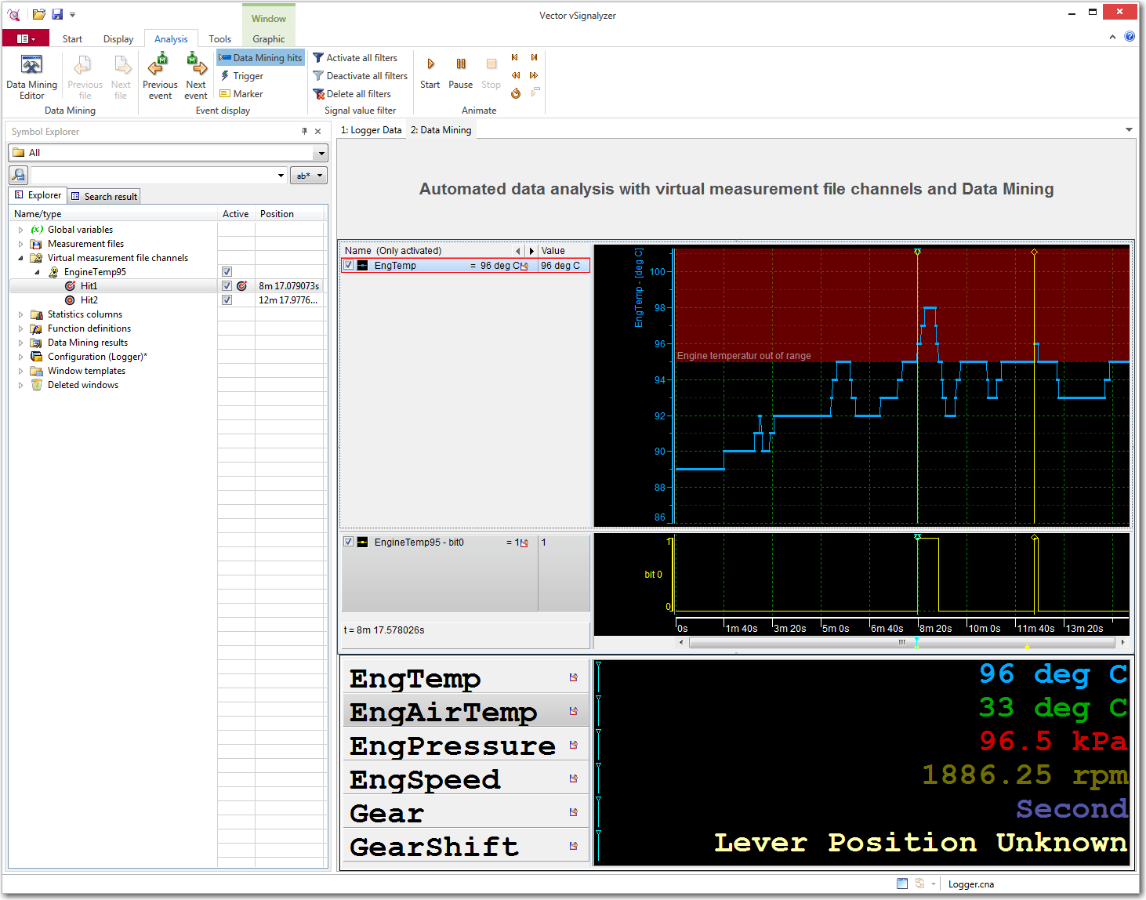
- Automated analysis processes: Evaluate large volumes of data automatically based on defined criteria
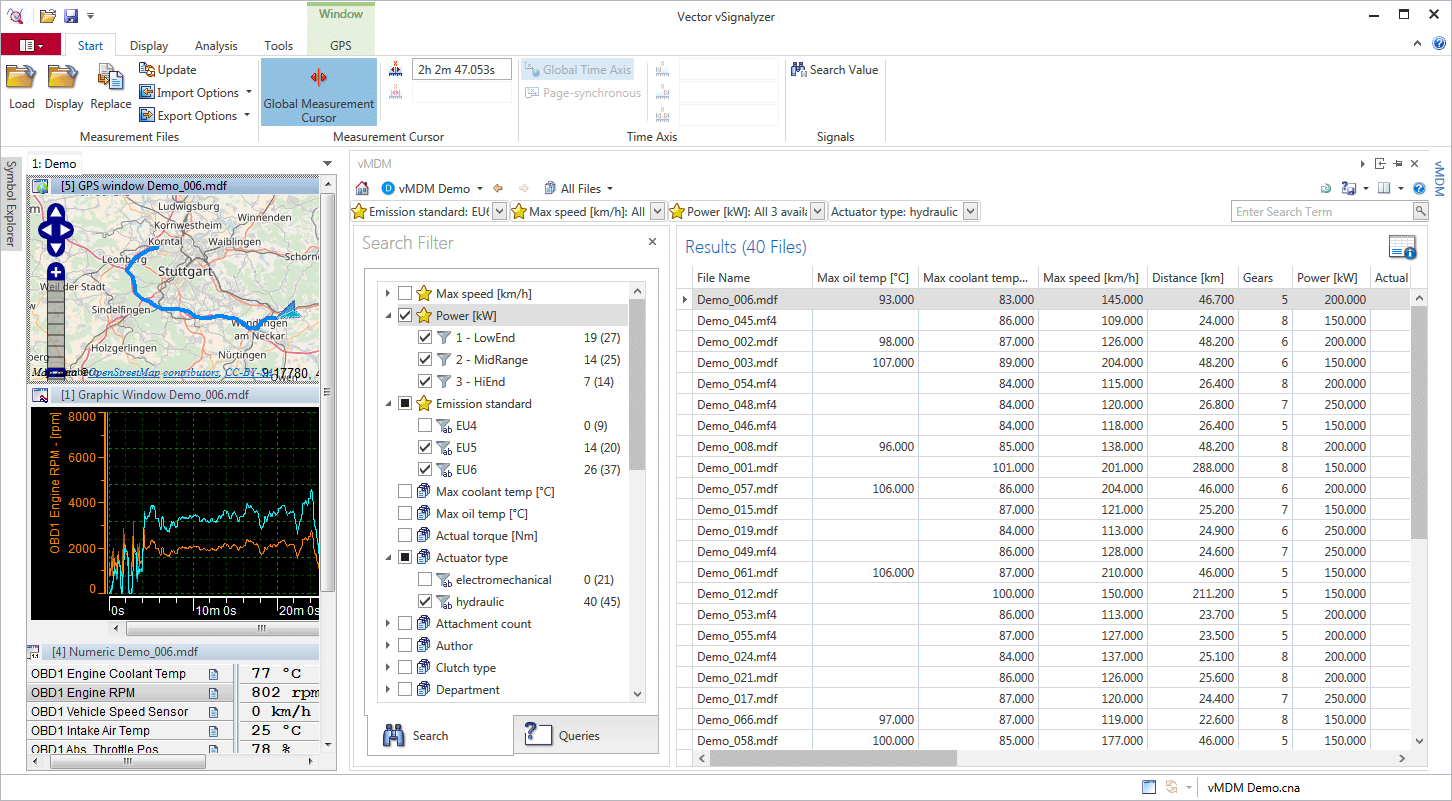
- Fast data search: Index local MDF files and quickly retrieve relevant measurement data
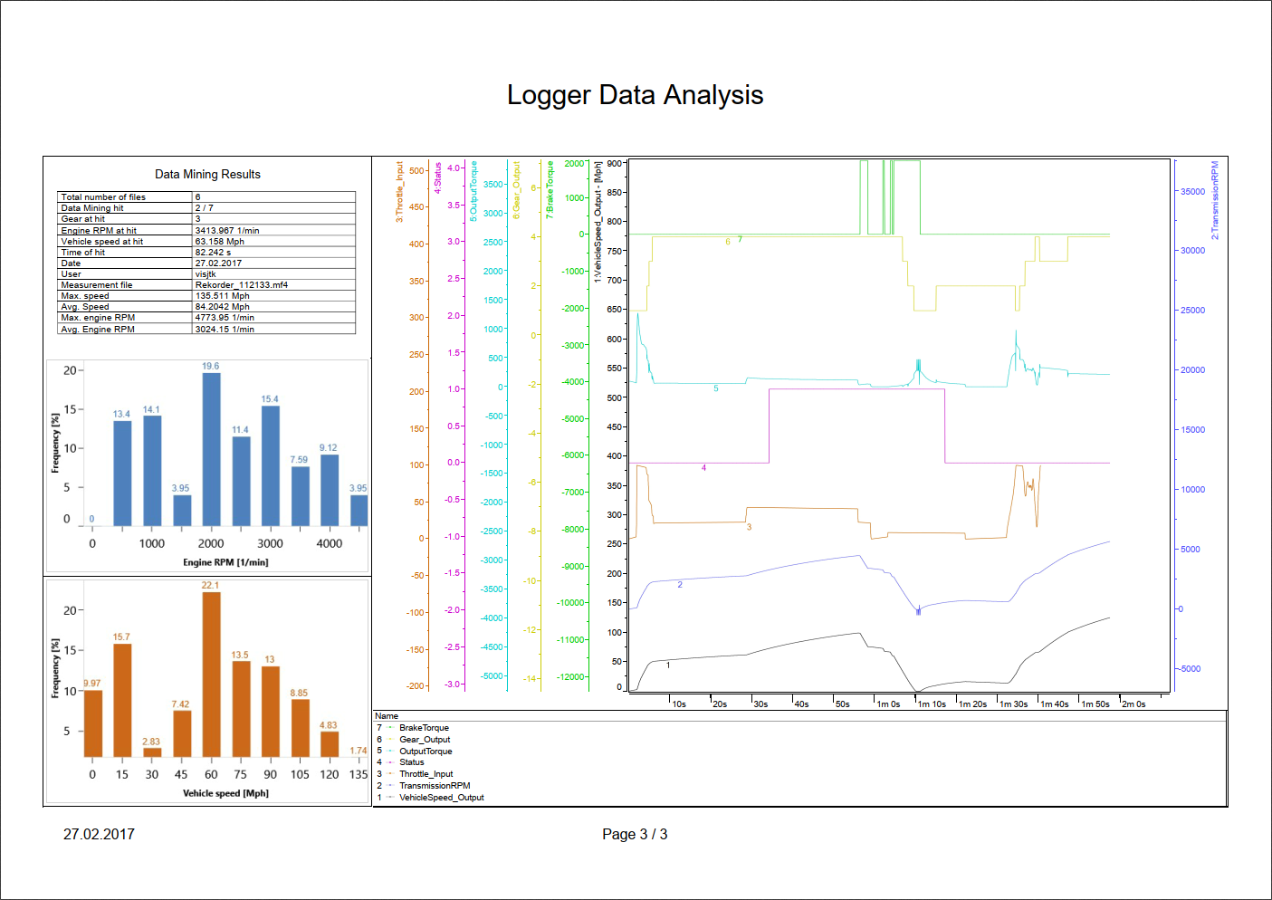
- Meaningful reporting: Document analysis results in a structured and reusable way
Feature Spotlight
Automated Data Analysis and Reporting
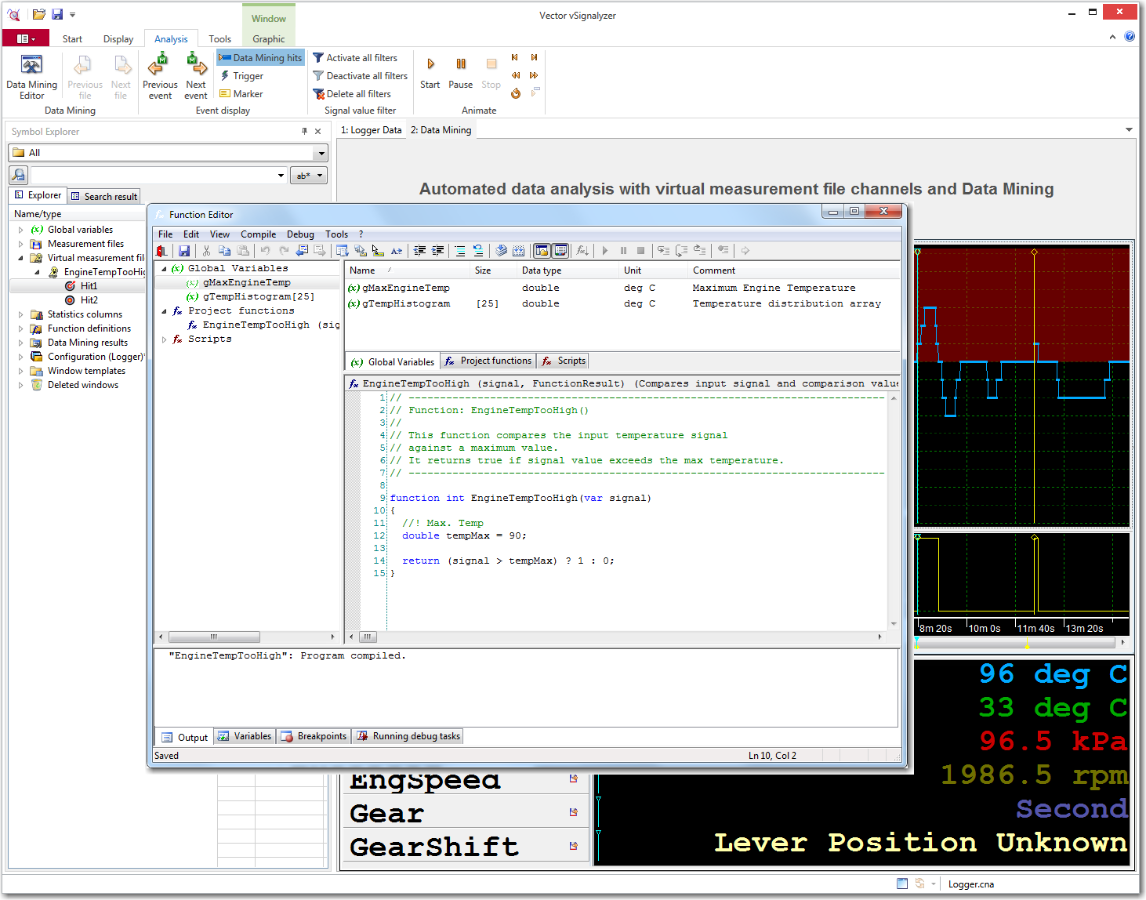
vSignalyzer enables focused evaluation of relevant measurement data through automated analysis processes. User‑defined control panels can be created to control the analysis workflow and visualize measurement results. Even extensive evaluation functions and data mining computations can be started with only a few mouse clicks and executed fully automated, allowing complex analyses to be used by less experienced users as well.
Thanks to its high degree of automation, vSignalyzer efficiently evaluates large numbers of very large measurement files, for example overnight. In addition, vSignalyzer provides tools for quickly inserting measurement results into reports or printing them. A configurable print preview already shows the layout of the final document during evaluation. Drag‑and‑drop functions support integration into external applications such as Word or PowerPoint.
Gallery
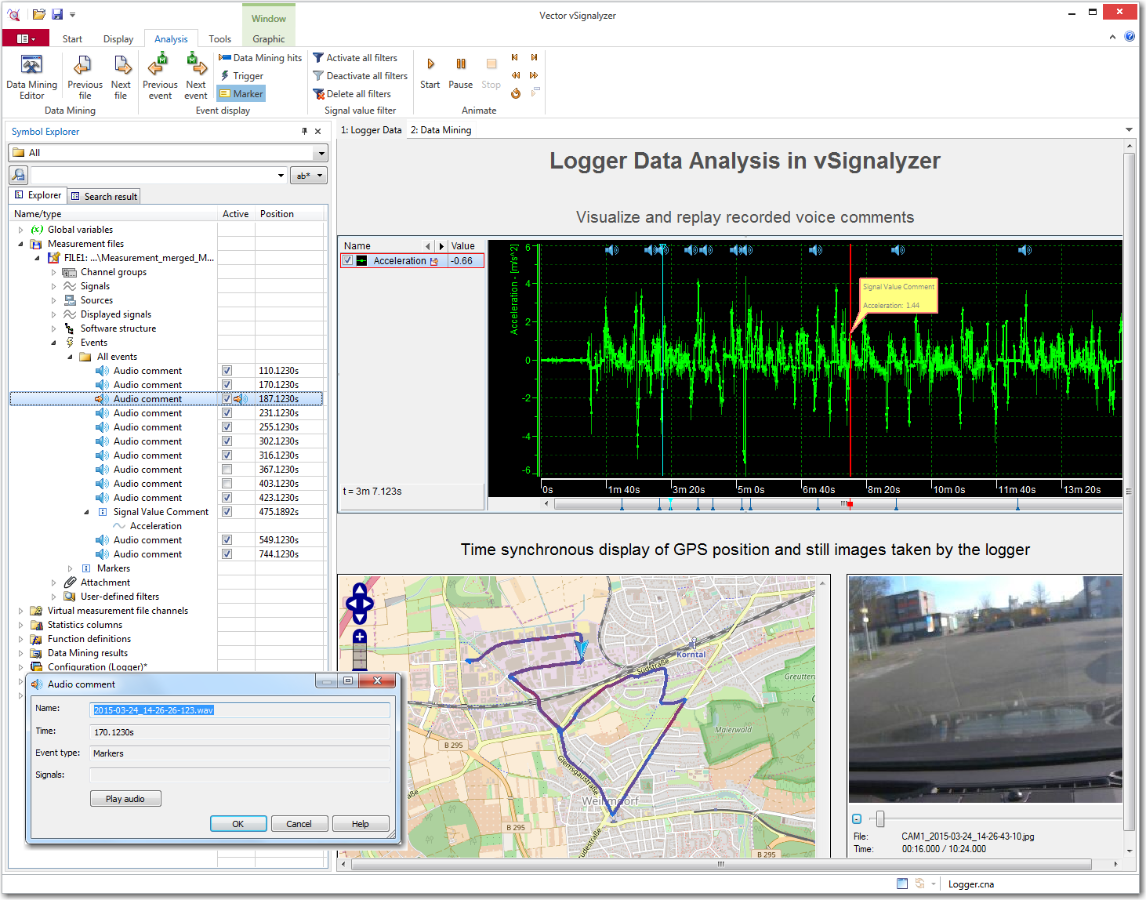
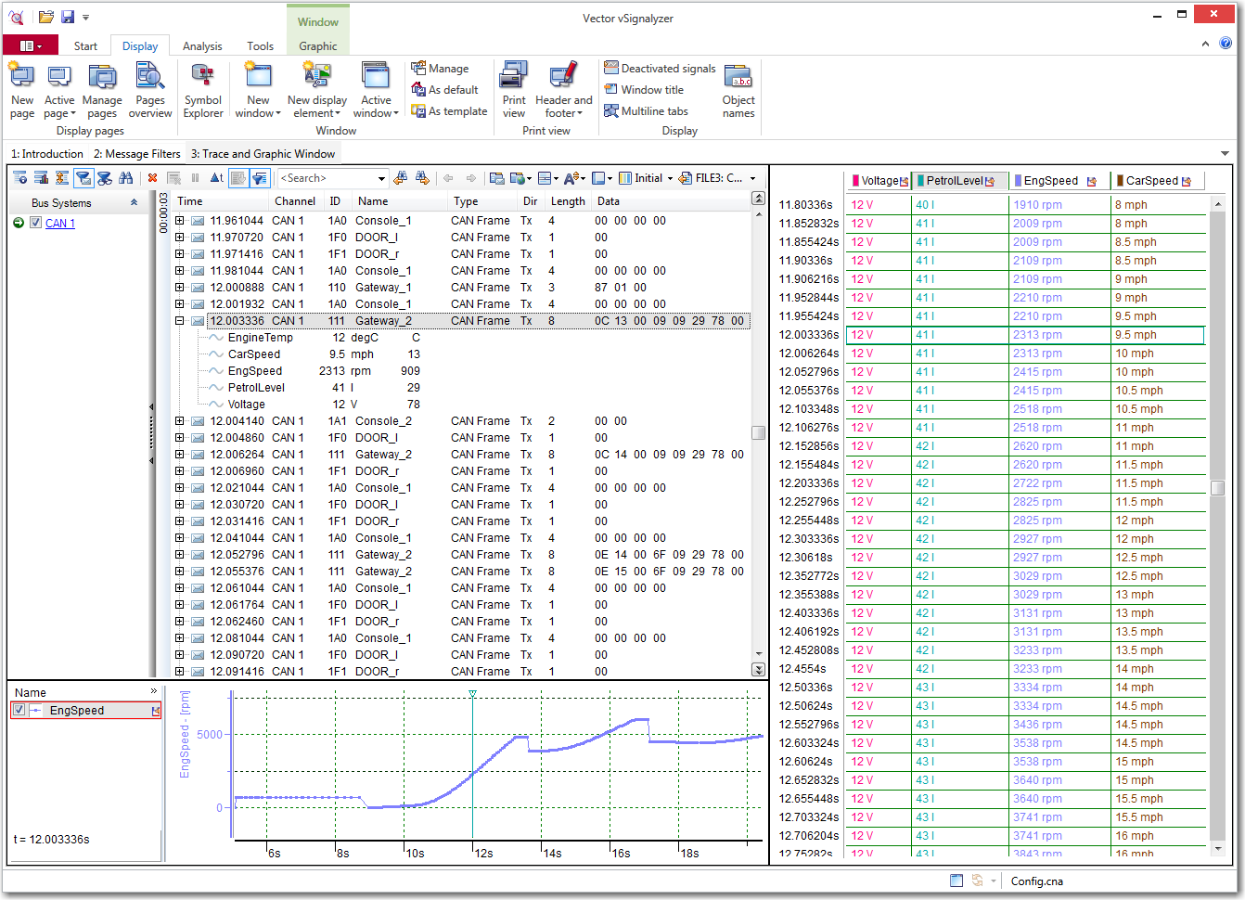
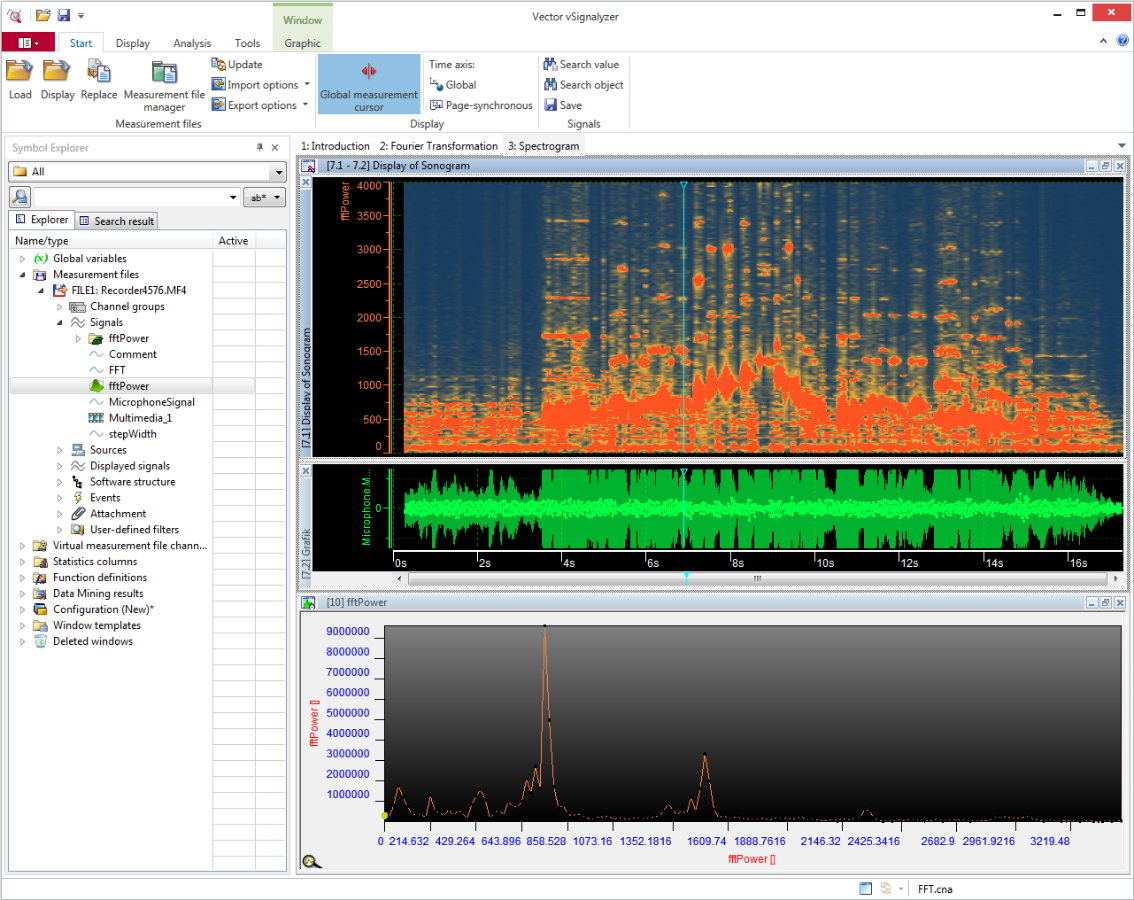
Highlights of Version 24
- Validation of ADAS algorithms: Visualize detected free space and obstacles to assess perception results
- Thesaurus function for measurement data: Automatically assign signals with differing names and ensure consistent analysis
- 100 GB cloud storage: Use cloud storage for logging projects and data exchange via Vector Team Services at no additional cost
Supported Measurement File Formats
vSignalyzer supports working with measurement data in various file formats: MDF-3.x, ASAM MDF-4.x, INCA DAT, XLS, XLSX, MATLAB MAT 7.3, HDF5, TDMS
For formats that vSignalyzer cannot process directly, corresponding import converters are available. The conversion happens automatically when the file is loaded into vSignalyzer: BLF, ASC, ASCII, ATFX, CLF, CSV, GLX, GPX, KME, NMEA 0183, PCAP, TTL, UBX, XLG, XLX
If further processing of measurement files in a different file format is necessary, vSignalyzer supports conversion of MDF files to a number of target formats: ASCII, MATLAB (M/MAT), Excel
Options
Driver Assistance
Object verification for ADAS applications, even at high data rates: In sync with the measurement, detected object data can be displayed in various views, such as an overlay in the recorded video or in the 3D scene window.
Thermodynamic State Charts
With the option Thermodynamic State Charts for CANape, you can display thermodynamic data synchronized with other measured data and generate highly informative state charts for online and offline analysis.
Product Descriptions
Related Products